AEM Chrome Plug-in - Adaptive Form
BetaAvailable since version 0.2.0
Quick Links
Requirements
- Requires AEM 6.2+ with the AEM Forms add-on package installed
- This is is a development tool and should not be used on production instances.
- ACS AEM Tools is not required
Purpose
AEM Chrome Plug-in - Adaptive Form is a Chrome browser extension that provides a suite of development tooling in-browser to aid in the development and debugging of AEM Adaptive Forms. It provides high-level information about the performance and errors in an adaptive form. In addition, it allows the user to enable logs, debug scripts, and explore Guide Bridge APIs.
The Adaptive Form tab further organizes the information in the following tabs.
- Performance
- Keyword Errors
- BindRef Errors
- Logging
- Debugger
- Guide Bridge Playground
Note: All tabs are not active in authoring and runtime modes. The tabs are active depending on the mode in which the form is opened.
How to use AEM Chrome Plug-in - Adaptive Form
- Install AEM Chrome Plug-in via the Chrome web store.
- Open up Chrome Dev Panels (Chrome > View > Developer > Dev Tools) and click on the AEM tab.
- Pro tip: You can drag to re-arrange Dev Tool tabs.

- Pro tip: You can drag to re-arrange Dev Tool tabs.
- Navigate to Adaptive Form Tab.

- Use AEM Chrome Plug-in!
Adaptive Form Author mode
When you open an adaptive form in authoring mode, only the Performance, Keyword Errors, and BindRef Errors tabs are active. Active tabs in authoring mode include a Reload button. If you make changes to a form, you can click Reload to view the current state of the updated form in the dev tools window.
Note : The Authoring mode features of the plugin are supported only for Touch UI.
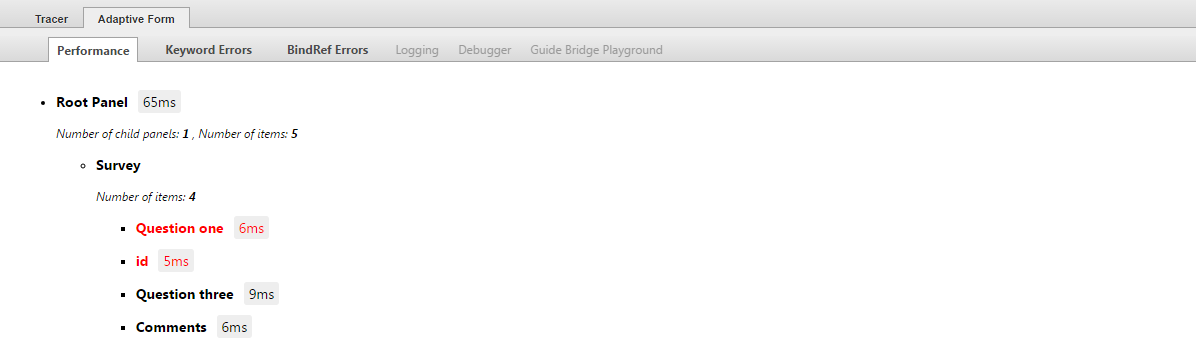
Performance
The Performance tab displays the entire node structure of the form as a tree. Each item in the tree displays the title of the component (or the name if title is missing) and the server time taken to render the component. The time taken for a panel to render is composite of the time taken to render all of its child components. If the time taken to render a component is in seconds, the time for that component is highlighted to indicate higher load time than other components. The tree also displays the number of child panels a component has and number of items in each component. This information helps you optimize the form structure so that the form loads faster. You can also navigate to a component by clicking it in the tree. It brings the focus on the clicked component.
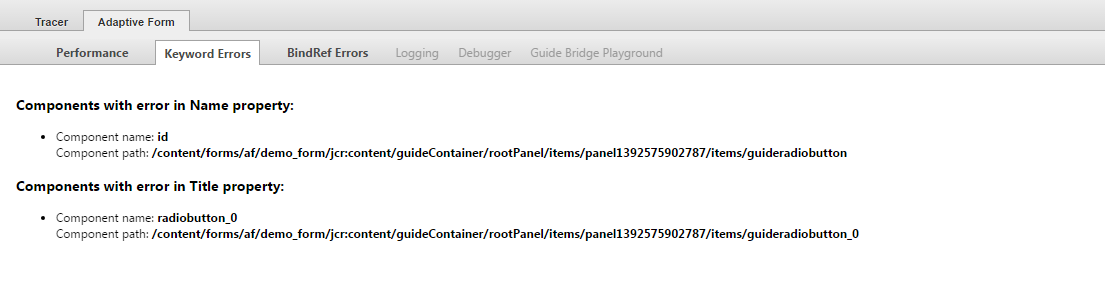
Keyword Errors
There are some reserved keywords for use by adaptive forms. These should not be used for name and title property for any component. Using these keywords leads to unexpected errors in the form. The Keyword Errors tab shows the list of component names and their paths in which one or more reserved keywords are used. You can directly navigate to the form component by clicking on the component in the list.
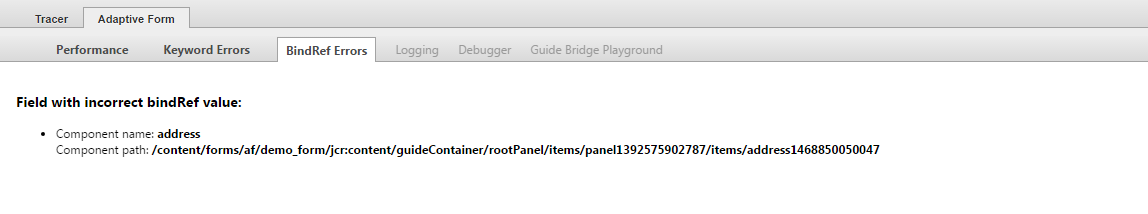
BindRef Errors
A bindRef is the connection between an adaptive form component and a schema element or attribute. It dictates the XPath where the value captured from this component or field is available in the output XML. The BindRef Errors tab shows errors related to the bindRef property of components. Errors may occur due to following reasons:
- The bindRef of a component is missing from the data model. This is a case of incorrect bindRef.
- The bindRef of a component is incorrect (i.e. the bindRef does not exist in the data model).
- An unbounded field in a bounded repeatable panel. Adaptive form does not support it.
- The value of the minOccur property is less than 1.
The details include component names and paths in which an error is reported. You can directly navigate to the form component by clicking on the component in the list.
Adaptive Form Runtime mode
When a form is rendered in runtime mode, the active tabs are Logging, Debugger, and Guide Bridge Playground.
Logging
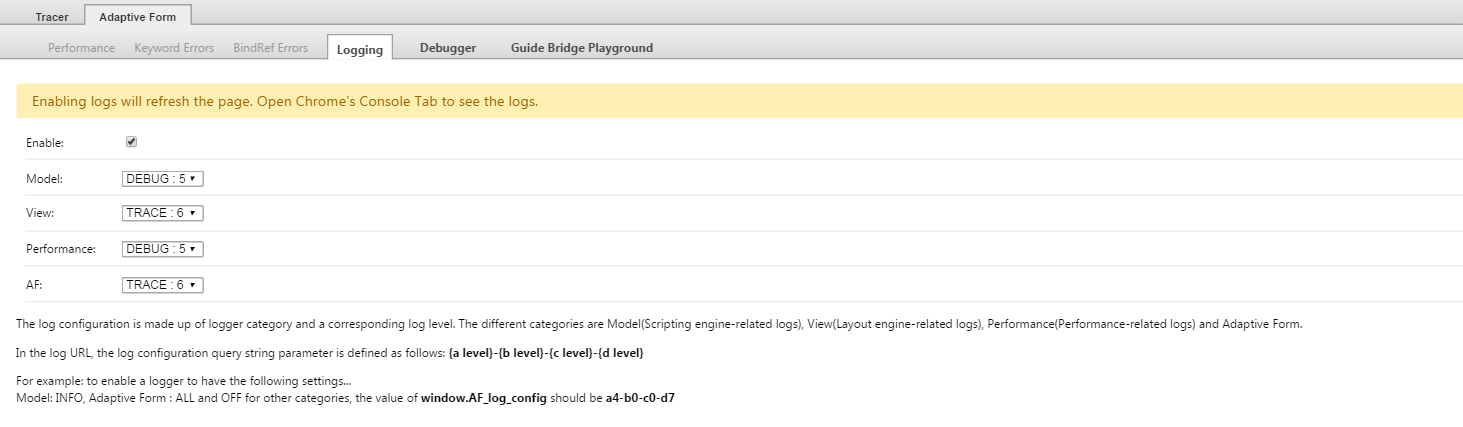
Adaptive form offers logging capability. The Logging tab allows you to enable and configure logs that help you debug form-related issues. The log configuration for adaptive forms takes four parameters — Model, View, Performance, and AF. You need to specify the levels for each logging parameter. You can also disable logging by deselecting the checkbox. Logs are displayed in the console tab of the dev tools.
NOTE - Enabling logs will refresh the page.
Debugger
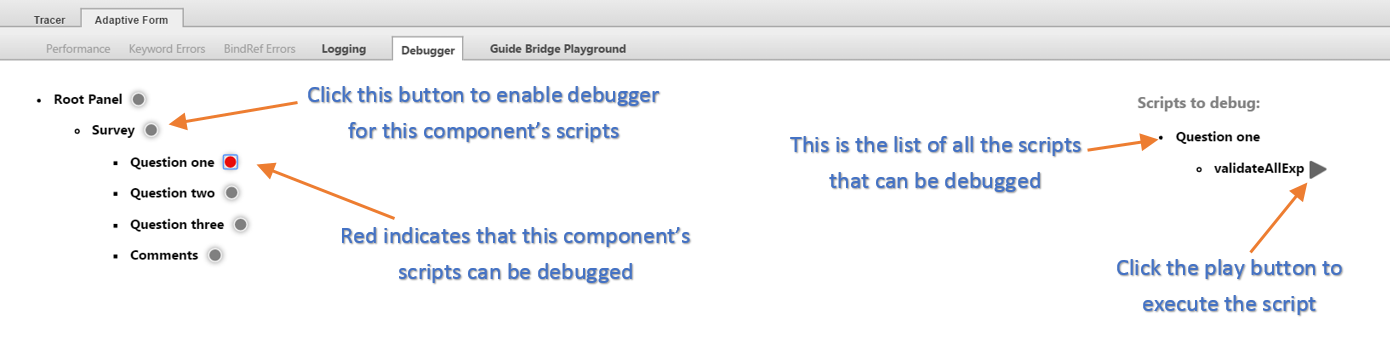
The Debugger tab allows you to debug rules or scripts written on the component. You can write scripts on form components using the rule editor and debug them in the Debugger tab. On clicking the button in front of the component in the tree, a debugger is attached to the first statement of all the scripts applied on that component. Each script has a Play icon against it, which you can click to run the script. When the script is run, the execution stops at the first statement and all the remaining statements of the script can then be debugged. After debugging a script, you can then click the Red button to turn off debugging for the component.
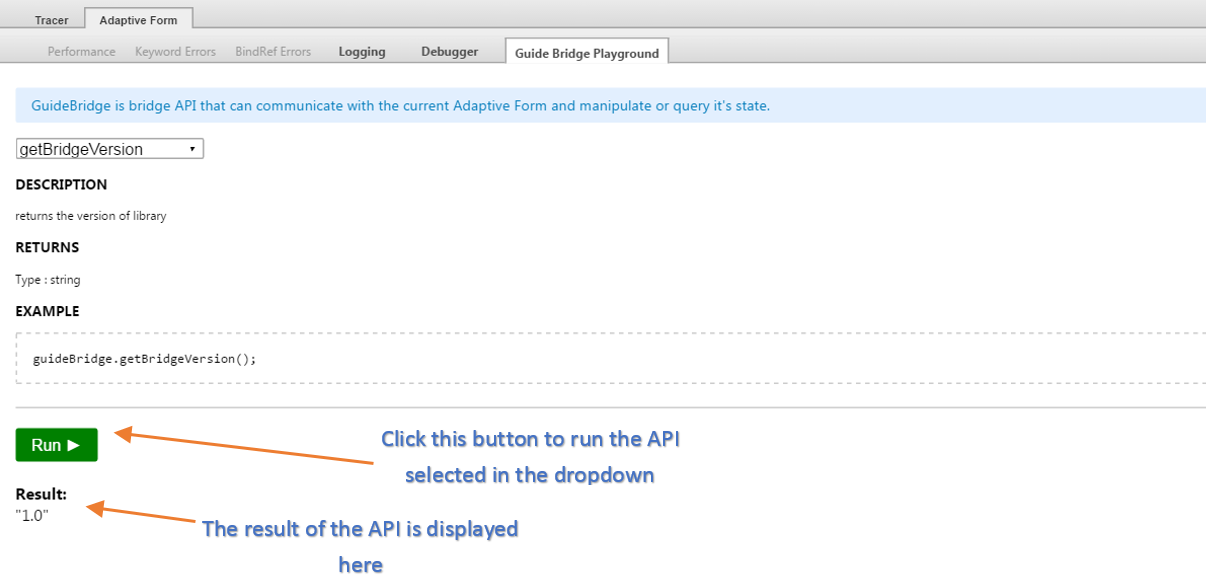
Guide Bridge Playground
The Guide Bridge Playground tab lists guideBridge APIs. You can select any API from the drop-down list to display its details like description, number of required parameters, type of required parameters, parameters description, the return type of the API, and so on. You can also input values for the parameters.